BCO Persistence
This section introduces how InfluxDB and the BCO Influxdb Connector app can be used to store the history of unit service state changes. This can for example be useful to persist and monitor the current economy level of your smart environment.
How to setup InfluxDB via docker
Download and run the docker container via:
sudo docker run \
  --name influxdb \
  --network=bco-net \
  --publish 8086:8086 \
  --volume influx_data:/var/lib/influxdb2 \
  --volume influx_config:/etc/influxdb2 \
  --restart=always \
  --log-driver=local \
  --detach \
  influxdb:latest
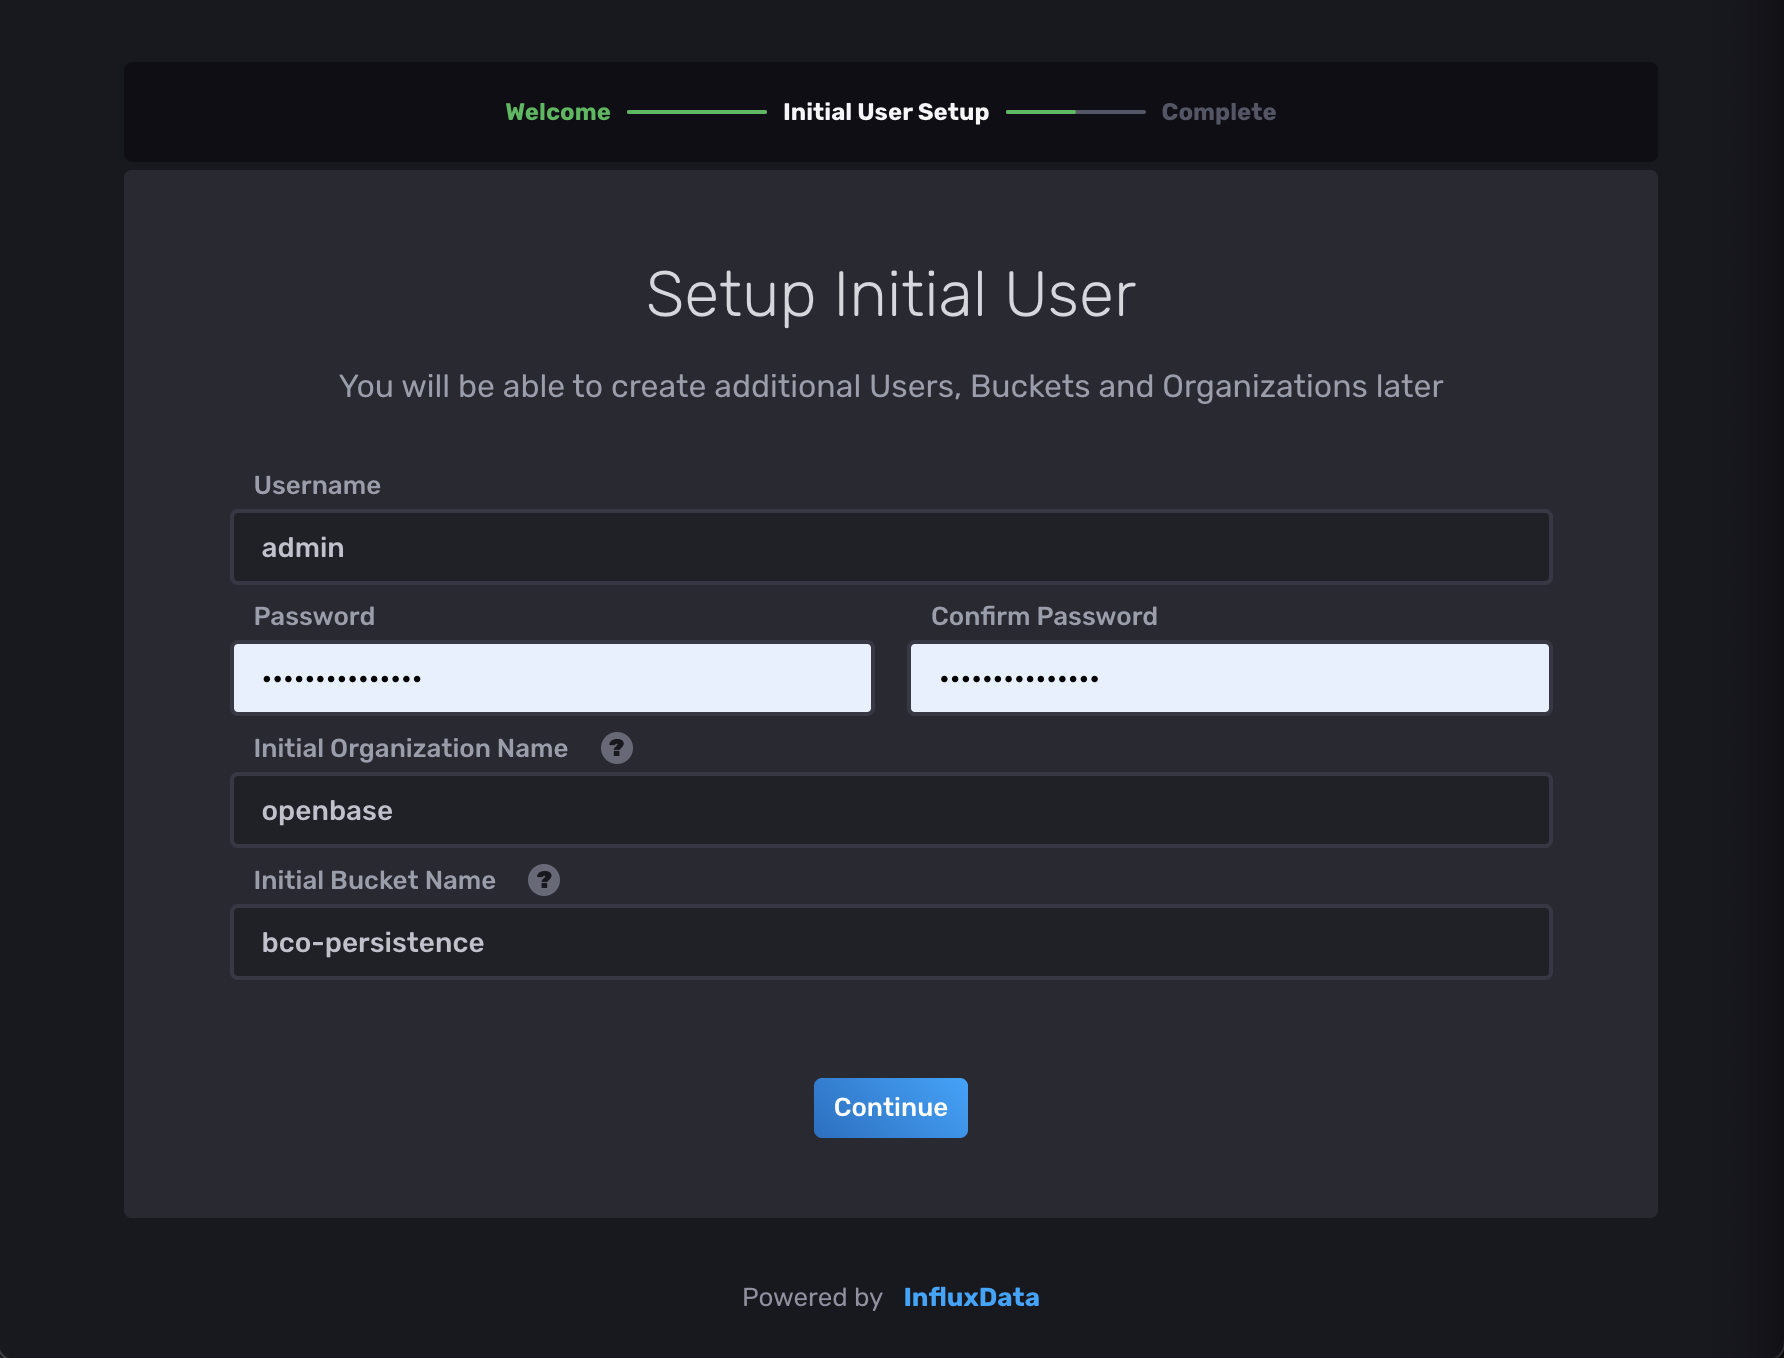
Choose openbase as organization name and bco-persistence as bucket name to simplify this setup.
 After the container spins up, please follow the onboarding via homecube by
setup your initial user, bucket and organization.
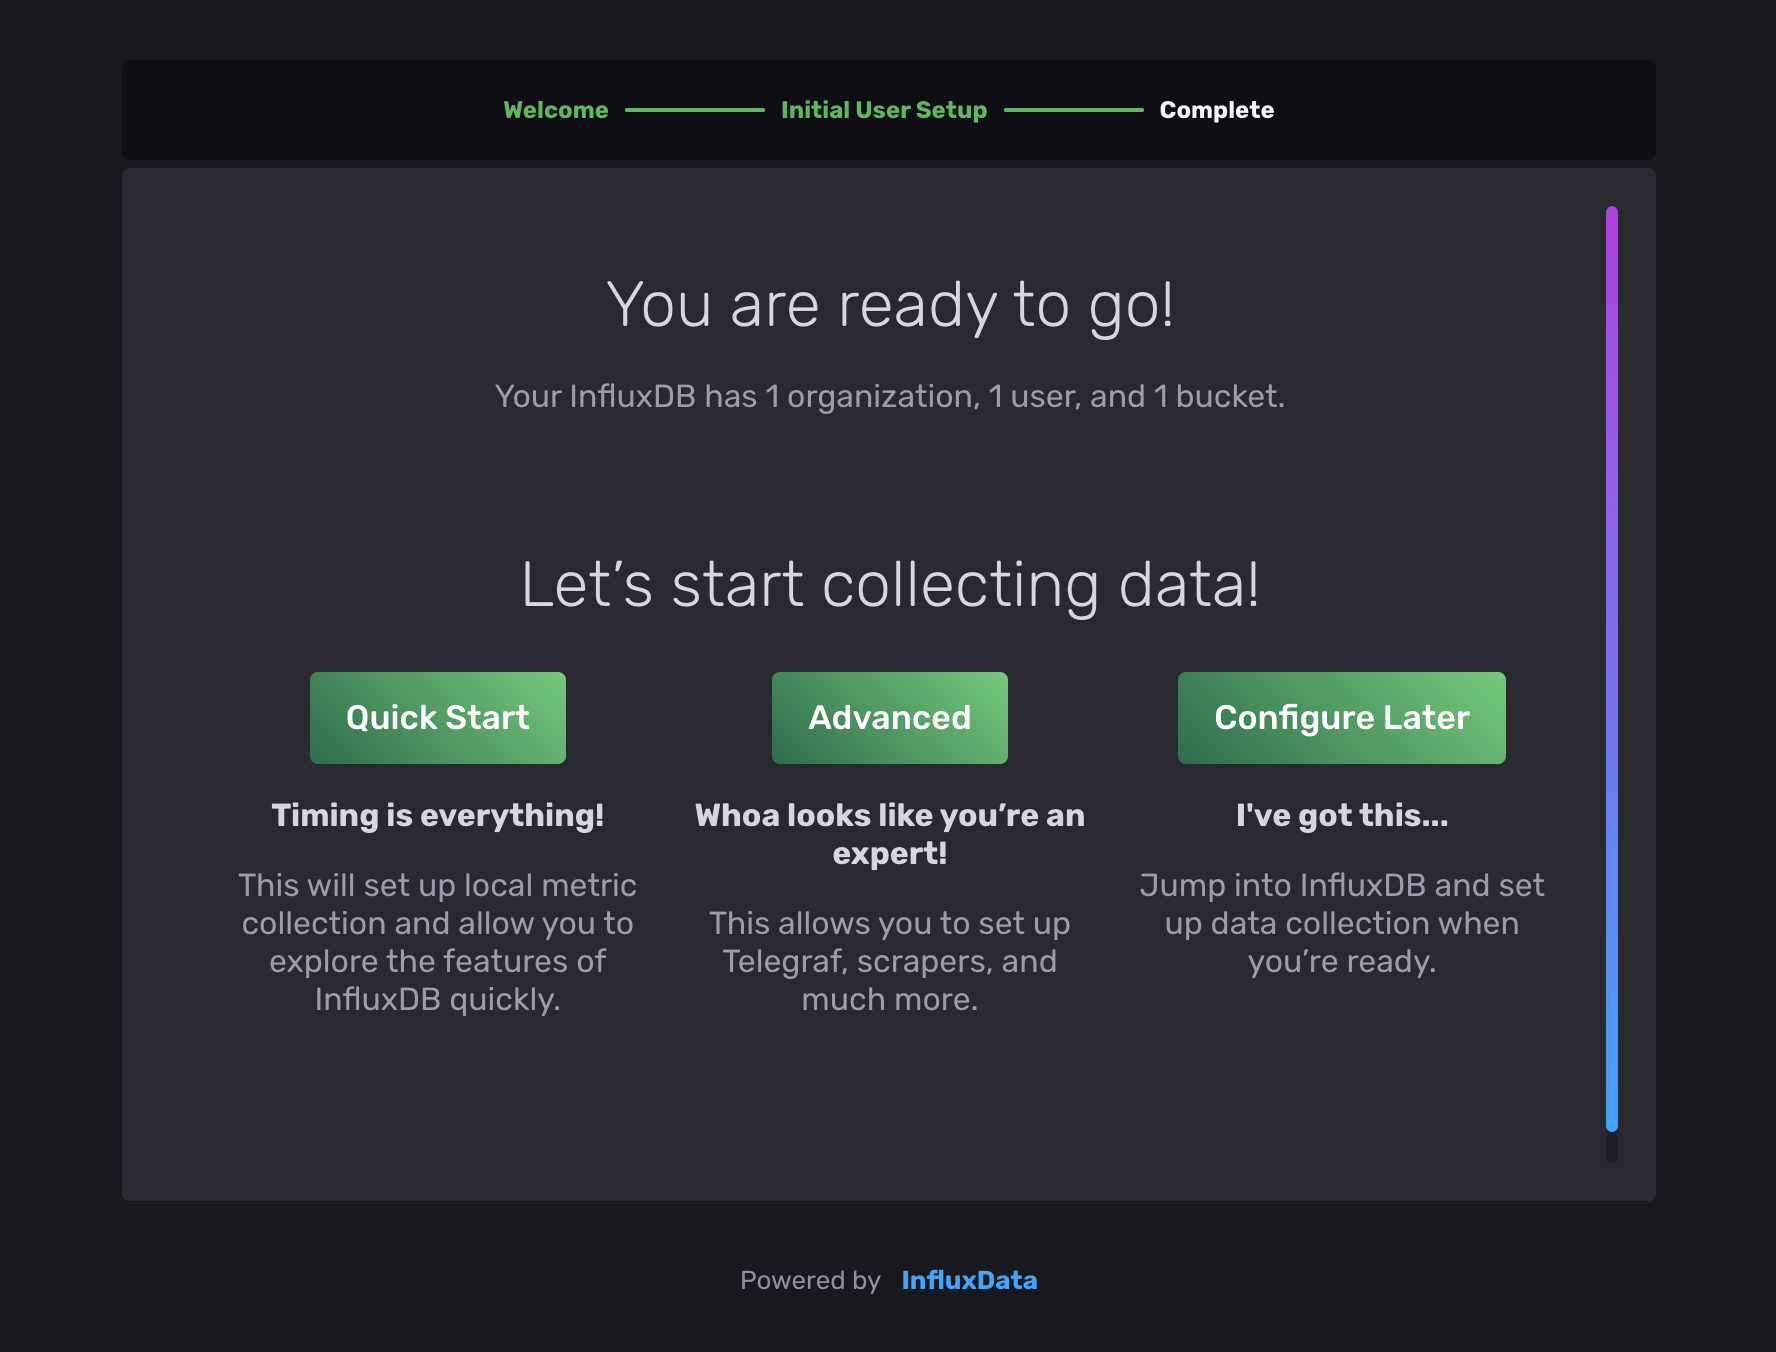
 Once done, influxdb is up and running and you can press
 Configure Later to continue with the bco setup.
How to setup the BCO Influxdb Connector App.
The BCO Influxdb Connector is a BCO app that persists all unit changes into influxdb.
1. Register the new App via the UnitRegistry
To install the InfluxDbConnector you need to register it by using the bco-registry-editor.
So please make sure you are connected to your BCO instance and start the bco-registry-editor --host homecube.
Than, you need to navigate to: UnitRegistry → App

Now add a new unit with right click → Add
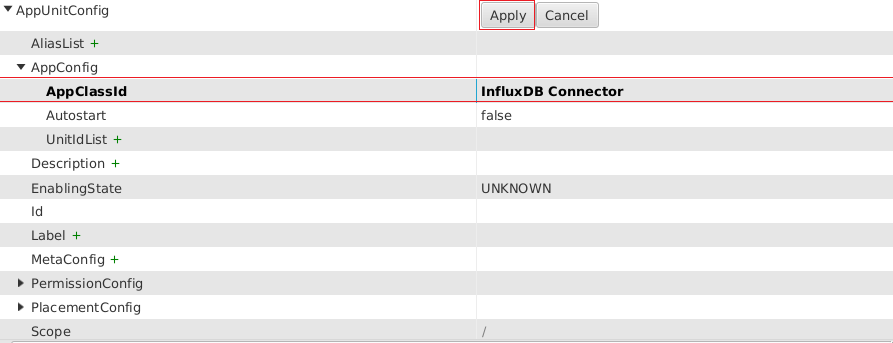
To add the InfluxDB connector class to the new unit, select InfluxDB Connector as AppClassId and press apply.
2. Authenticate and Configure the App via Meta Configs
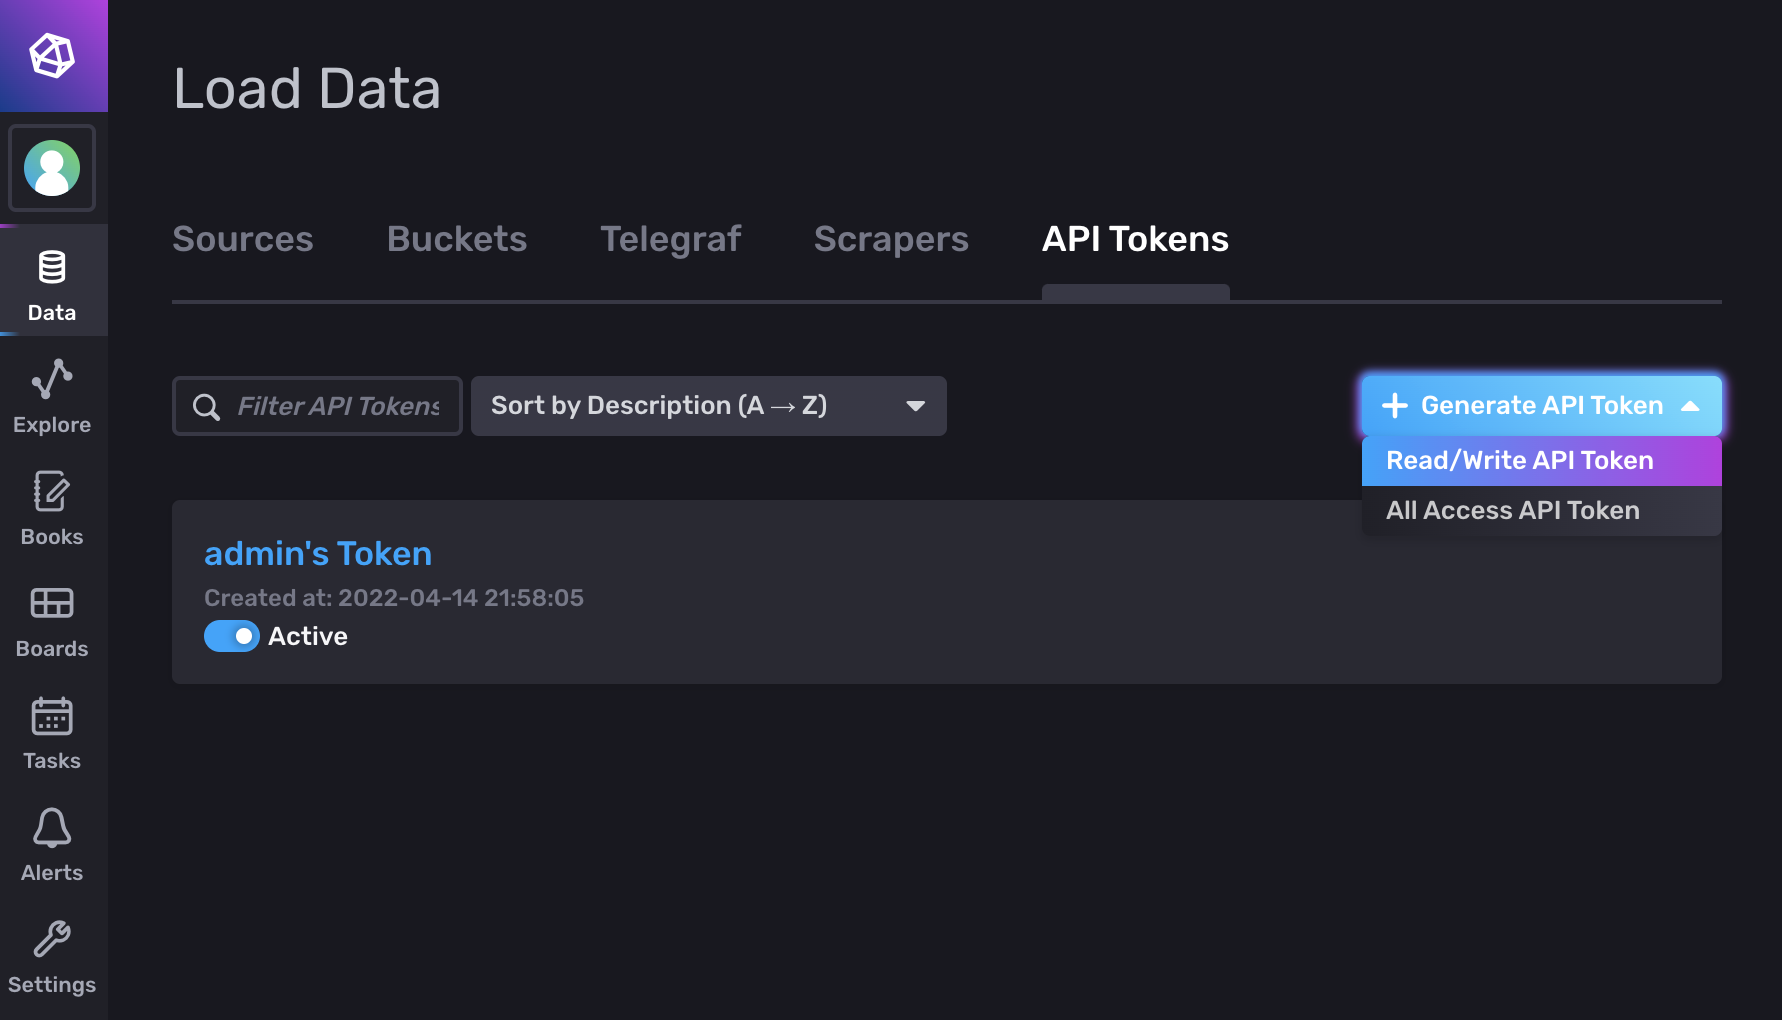
Switch to the token overview and create a new (READ/WRITE) API token to grant BCO write access.
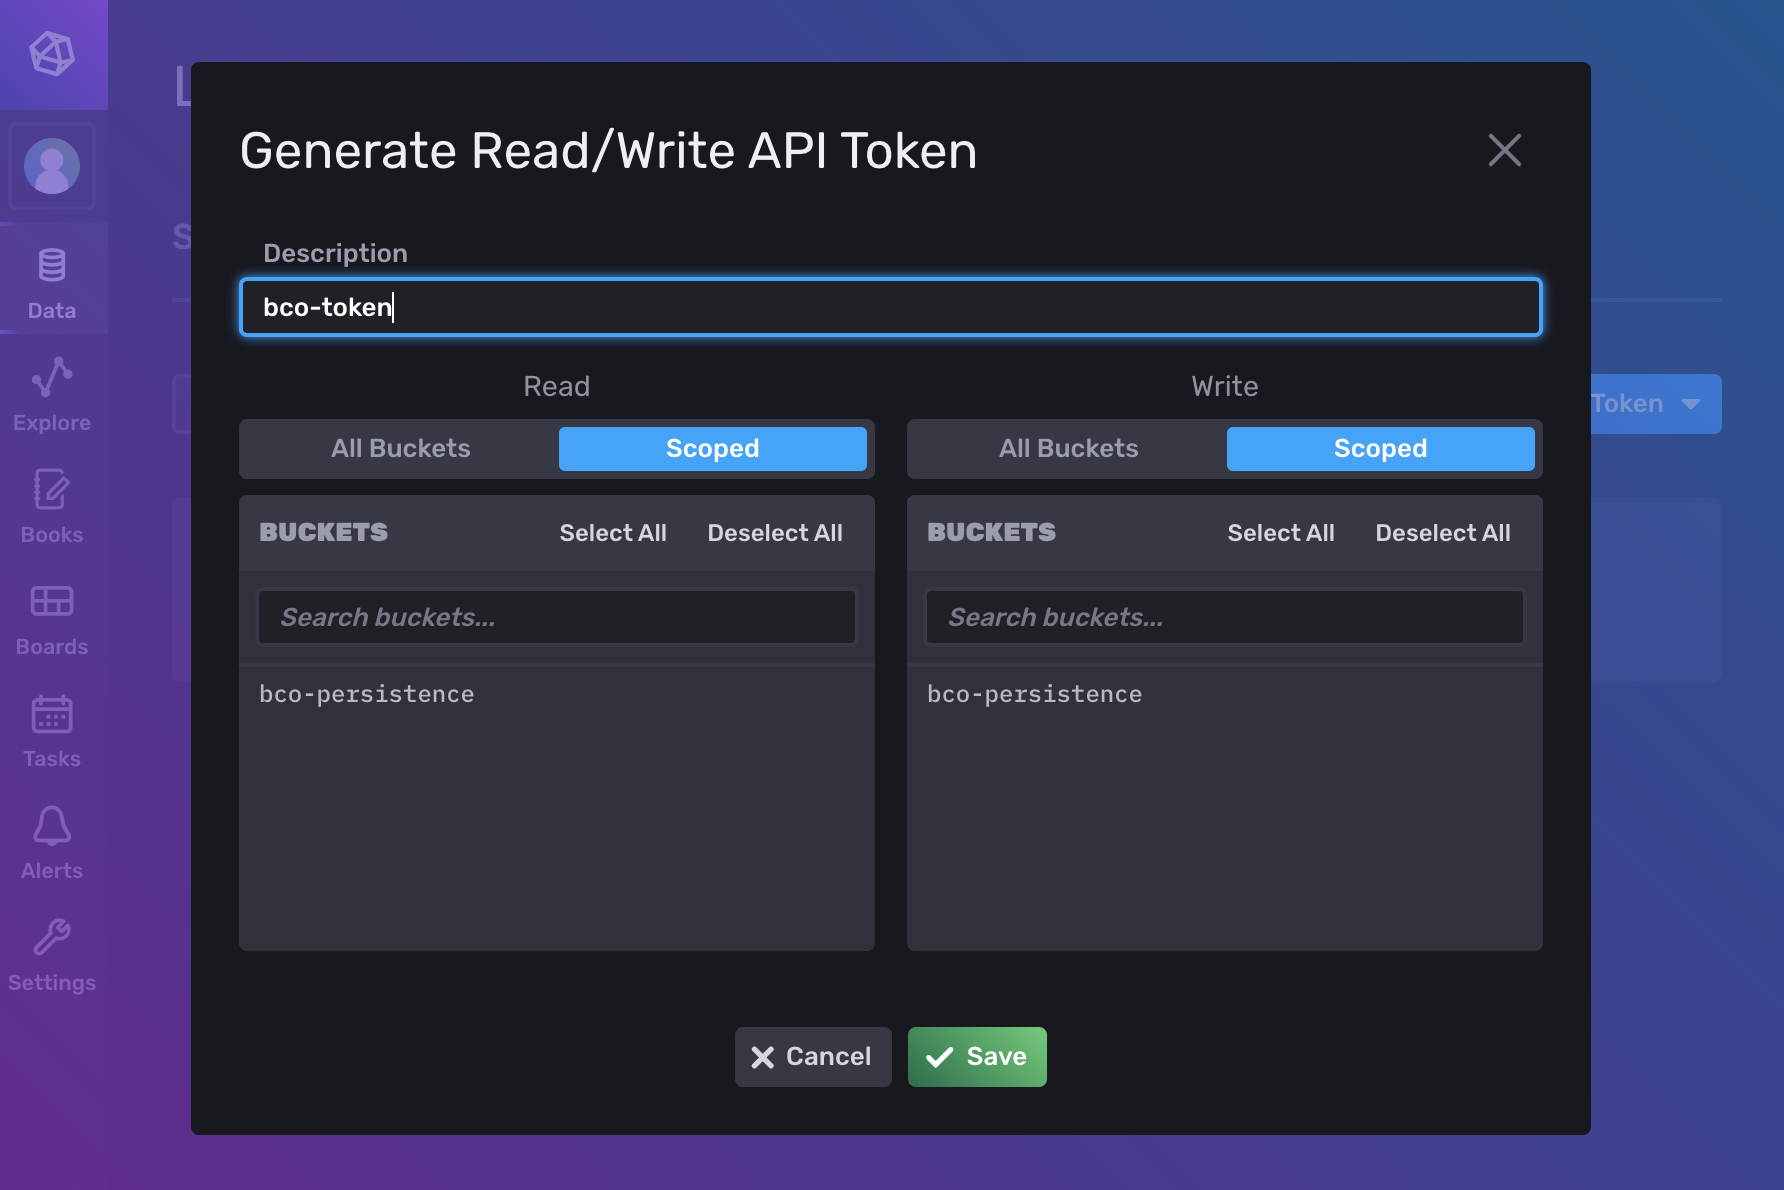
Don't forget to select the bco-persistence buckets.
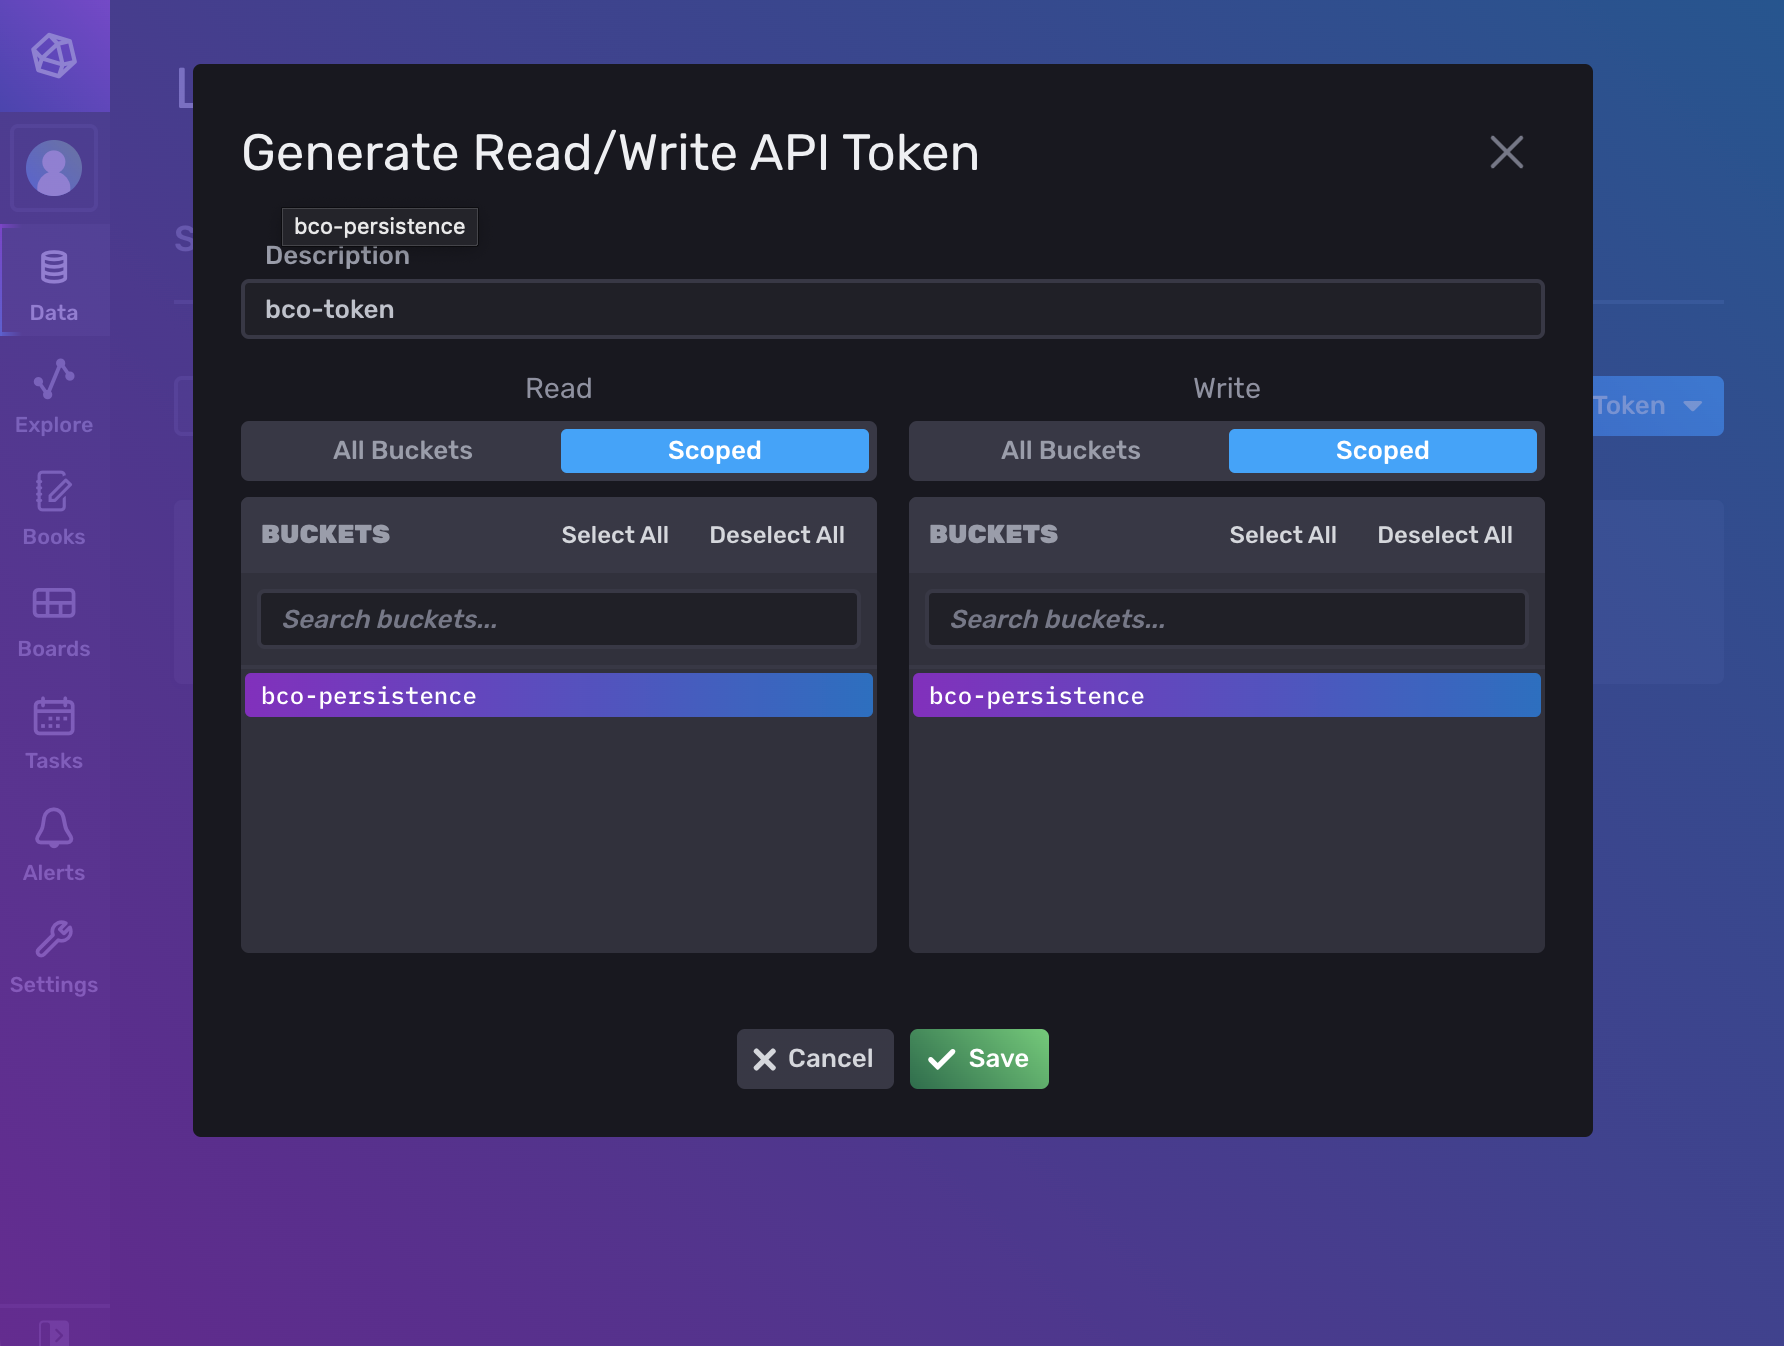
Finally open the token menu...
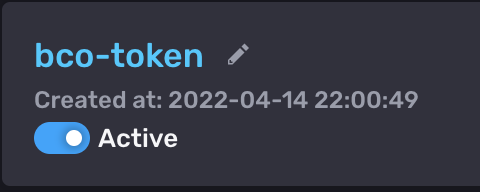
... and copy the key
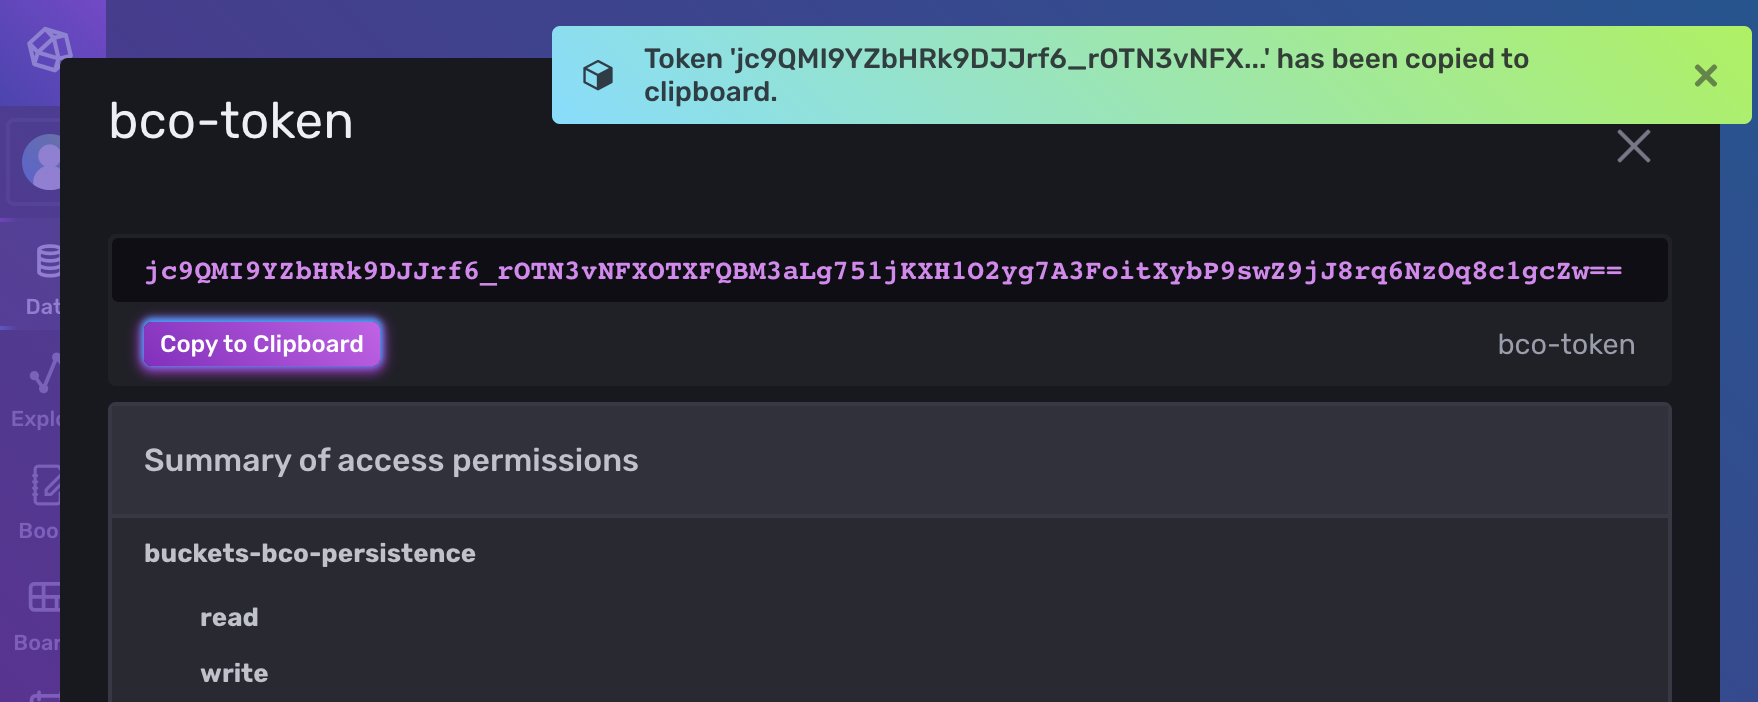 Transfer the token to a new MetaConfig entry of the
 BCO Influxdb Connector via the bco-registry-editor e.g. INFLUXDB_TOKEN = <PASTE_TOKEN_HERE>
In case you choose the default values during the influxdb setup and you run influxdb on the same host as influxdb is running, all values except INFLUXDB_TOKEN are optionally.
Further configurable meta config entries are:
INFLUXDB_URL→ Url of your InfluxDB
DEFAULT:INFLUXDB_URL = http://influxdb:8086INFLUXDB_BUCKET→ Name of the bucket where your data will be stored
DEFAULT:INFLUXDB_BUCKET = bco-persistenceINFLUXDB_BATCH_TIME→ Time limit(ms) after your batch is written to the database
DEFAULT:INFLUXDB_BATCH_TIME = 1000INFLUXDB_BATCH_LIMIT→ Max size of your batch
DEFAULT:INFLUXDB_BATCH_LIMIT = 100INFLUXDB_ORG→ Org for the bucket
DEFAULT:INFLUXDB_ORG = openbaseINFLUXDB_TOKEN→ Token with read and write access to your database
How to query influx db.
InfluxDB 2 uses Flux as a functional data scripting language. A good guide how to get started with Flux is provided by the official Influxdb Documentation.
How to create a Query
Chronograf is the user interface and administrative component of the InfluxDB platform. It is already included in influxdb 2 With Chronograf you can quickly see your data and build dashboards.
Therefore, you need to log in into the Chronograf webview and select the Data Explorer.
If you have run bco-test --simulate and collected some data in your bucket, you should see some measurements.
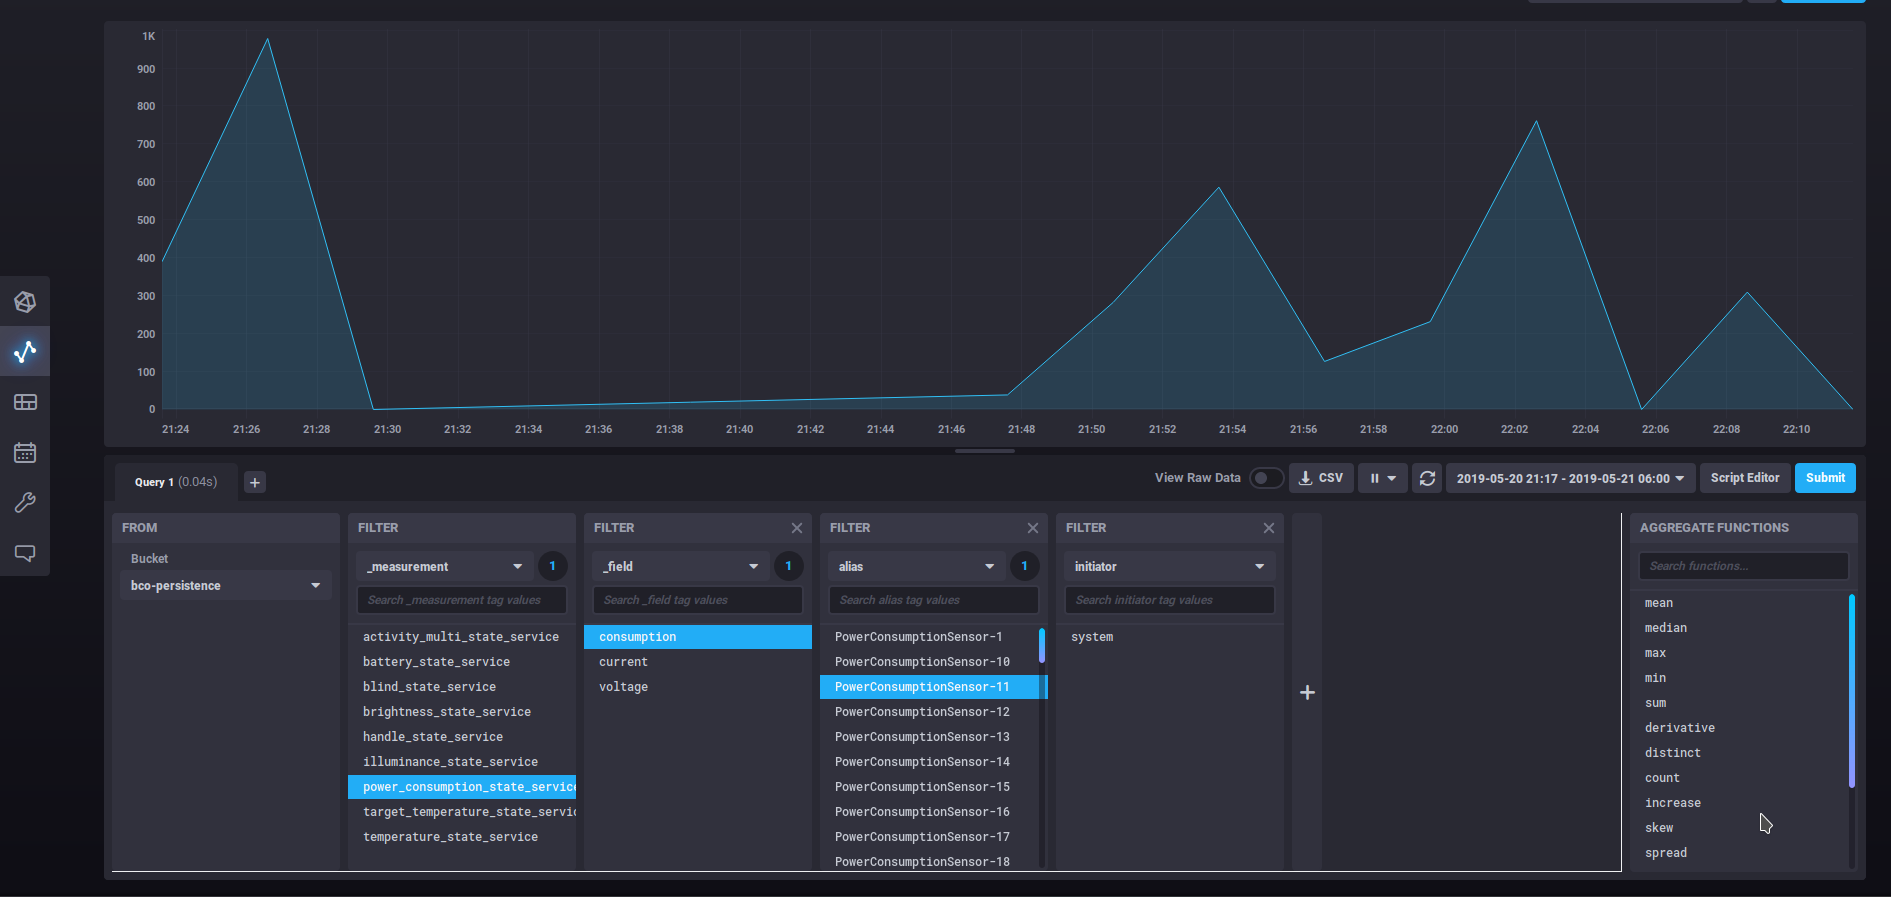
This query selects from the measurement power_consumption_state_service the field consumption data from the tag alias PowerConsumptionSensor-11.
It creates this query in Flux (you can see the query when you select the 'Script Editor'):

There are more options to visualize the data like raw_data, histogram table etc. You can also save your graphs into dashboards.
If you want know about the possibilities of chronograf you can have a look at the official documentation here Chronograf Documentation
Heartbeat
The database contains a measurement 'heartbeat' with the field 'alive'. If the influxdb connector app is started, the value one is written into this field. Every 15 minutes the value one is written into the field again. When the app is closed a zero value is written into the field. This can be used to check whether the database was functional and stored data. So you can consider possible downtimes during queries and calculations.
Service Aggregation
It is possible to perform a service aggregation via the function queryAggregatedServiceState of a unit. This function needs a QueryType as a parameter.
Important attributes of the QueryType for the service aggregation are:
- measurement
- service_type
- time_range_stop
- time_range_stop
- aggregation_window
To get an overview of the QueryType look here: Query
The method returns an AggregatedServiceState. Which contains the service_type, the query and the aggregated_service_type. Depending on whether the requested service_type is an enum or not, the aggregated_service_type consists of percentages of how often which status was active, or of the average values.
// Query for continuous data
Query query = Query.newBuilder()
     .setMeasurement("power_consumption_state_service")
     .setServiceType(ServiceTemplateType.ServiceTemplate.ServiceType.POWER_CONSUMPTION_STATE_SERVICE)
     .setTimeRangeStart(TimestampType.Timestamp.newBuilder().setTime(time - 3600).build())
     .setTimeRangeStop(TimestampType.Timestamp.newBuilder().setTime(time).build())
     .setAggregatedWindow("1m")
     .build();
AggregatedServiceStateType.AggregatedServiceState aggregatedServiceState = testLocation.queryAggregatedServiceState(query).get();
// Query for enum data
Query enumQuery = Query.newBuilder()
     .setMeasurement("button_state_service")
     .setServiceType(ServiceTemplateType.ServiceTemplate.ServiceType.BUTTON_STATE_SERVICE)
     .setTimeRangeStart(TimestampType.Timestamp.newBuilder().setTime(time - 3600).build())
     .setTimeRangeStop(TimestampType.Timestamp.newBuilder().setTime(time).build())
     .setAggregatedWindow("1m")
     .build();

AggregatedServiceStateType.AggregatedServiceState aggregatedEnumServiceState = testLocation.queryAggregatedServiceState(enumQuery).ge();
The full example how to query an aggregated service state is available over here: HowToQueryAggregatedState
Query Database
You can also send raw queries to the database via the units with the queryRecord function.
This function needs also a QueryType as a parameter. However, the only attribute that must be filled is the raw_query.
The method returns an RecordCollection which consists of Records.
In the Chronograf and the Query-Section it is explained how a raw query looks like and how it can be built.
An example request looks like:
String query = "from(bucket: \"bco-persistence\")\n" +
     "  |> range(start:" + (time - 3600) + ", stop: " + time + ")\n" +
     "  |> filter(fn: (r) => r._measurement == \"power_consumption_state_service\")";
RecordCollectionType.RecordCollection recordCollection = testLocation.queryRecord(Query.newBuilder().setRawQuery(query).build()).get();
The full example how to query a database record is available over here: HowToQueryUnitLongTermStateUpdates.